Berkeley Data 8: Foundations of Data Science
Contents · 75
- 01-IntroductionIntroduces data science as exploration, inference, and prediction, and outlines Data 8 course resources, policies, collaboration, and support.
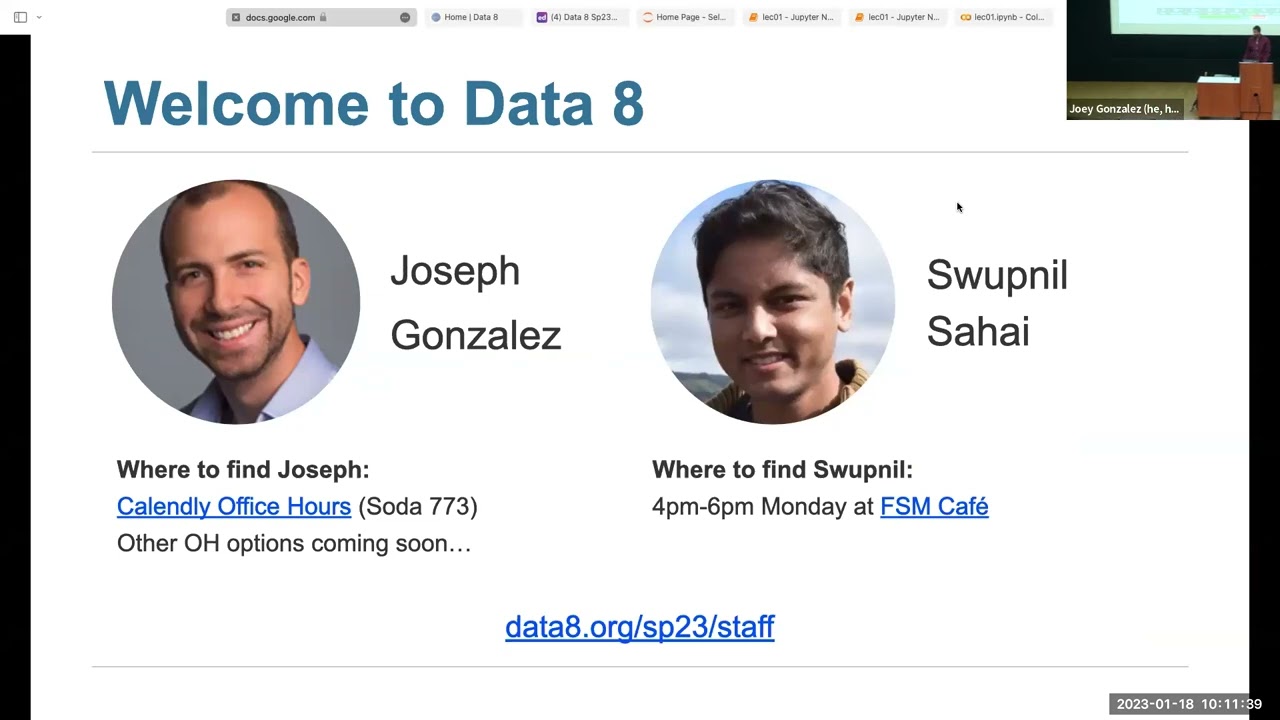
- 01-IntroductionIntroduces Data 8, its instructors and support resources, and the goal of making data science accessible to everyone.
- 02-Cause and EffectExplains the difference between association and causation, using chocolate and heart disease and John Snow’s cholera investigation to introduce control groups, confounding, and randomized experiments.
- 02-Cause and EffectIntroduces data science as drawing conclusions from imperfect information, using a meta-analysis of chocolate consumption and heart disease as a modern example.
- 03-TablesIntroduces Python fundamentals and table structure, then covers selecting, dropping, sorting, and filtering table rows and columns.
- 03-TablesIntroduces Python basics, notebook cells, Markdown, and interactive coding, alongside course announcements and office-hour details.
- 04-Data TypesCovers table selection, sorting, and filtering; Python numbers, strings, and types; and array operations.
- 04-Data TypesIntroduces CSV tables and the select, drop, sort, and where operations for exploring and filtering NBA player data.
- 05-Building TablesIntroduces arrays, ranges, and columns, then shows how to create and manipulate tables with examples.
- 05-Building TablesCovers Python arrays, indexing, data types, elementwise arithmetic, reductions, and creating and manipulating tables and columns.
- 06-CensusReviews table operations and analyzes U.S. Census population data, including coded values, age and sex categories, and limitations of historical classifications.
- 06-CensusReviews table creation, sizing, column references, and accessing data, with examples of combining columns from different sources.
- 07-ChartsExplains attribute types and choosing charts for relationships between numerical and categorical data, with guidance on clear visualization practices.
- 07-ChartsIntroduces data visualization, its uses for storytelling and exploration, and how column data types guide visualization choices.
- 08-HistogramsVisualizes categorical and numerical distributions with bar charts and histograms, explaining binning, density, and the area principle.
- 08-HistogramsIntroduces variable attributes and distributions, then uses a survey to illustrate categorical data frequencies and percentages.
- 09-FunctionsIntroduces Python function definitions and return values, then shows how to apply functions to table columns.
- 09-FunctionsHistograms’ bar area represents the percentage of data in each bin, while bar height indicates how densely values are concentrated. Also demonstrates calculating movie ages from release years.
- 10-GroupsUsing `apply` to make predictions, then grouping and collecting data by column with counts, lists, and sums.
- 10-GroupsPredicting children’s adult height from parents’ average height using Galton’s data, then introducing table grouping.
- 11-Pivots and JoinsExplains grouping and aggregation, pivot tables, joining tables, and choosing the right table operations for data manipulation.
- 11-Pivots and JoinsLecture introduces Python lists, their heterogeneous contents and syntax, and why lists are useful for representing table rows with mixed column types.Introduces Python lists, their syntax and heterogeneous contents, and their role in representing table rows with mixed data types.
- 12-Table ExamplesReviews table methods and practices analyzing Bay Area bike-sharing data.
- 12-Table ExamplesRecaps table methods for selecting, filtering, sorting, grouping, reshaping, and joining data, with examples and a reference sheet.
- 13-Conditionals and IterationBoolean comparisons and aggregation, applying functions to table rows, conditional control flow, random selection, for loops, array appending, and filtering tables with `where`.
- 13-Conditionals and IterationPython Boolean expressions and comparisons, plus if statements, for loops, and introductory sampling.
- 14-ChanceIntroduces probability through equally likely outcomes, multiplication and addition rules, complements, sampling without replacement, and the Monty Hall problem.
- 14-ChanceIntroduces probability through Python simulations, using coin flips to illustrate equally likely outcomes and random choice.
- 15-SamplingIntroduces random sampling, empirical and probability distributions, the law of large numbers, and statistical inference using sample statistics.
- 15-SamplingExplains probability calculations and simulation using the Monty Hall problem, and introduces statistics and inference.
- 16-ModelsAssessing chance models by simulation, using jury selection and Mendel’s pea plants to test whether observed data are consistent with model predictions.
- 16-ModelsPlease provide the file title and the start of its text.Midterm preparation, exam logistics, course announcements, and an introduction to statistical modeling.
- 17-Comparing DistributionsUses simulated test statistics and total variation distance to compare categorical distributions, evaluate random sampling, and test null versus alternative hypotheses.
- 17-Comparing DistributionsCompares categorical distributions with more than two categories and introduces hypothesis testing, model-versus-alternative viewpoints, and statistics for assessing discrepancies between observed data and a model.
- 18-Decisions and UncertaintyHypothesis testing and statistical significance, including test statistics, null models, tail areas, and P-values.
- 18-Decisions and UncertaintyReviews hypothesis testing terminology, null and alternative hypotheses, simulation under the null, and choosing a test statistic.
- 19-A/B TestingExplains A/B testing with birth-weight data, null and alternative hypotheses, difference-in-means statistics, and permutation tests that shuffle group labels.
- 19-A/B TestingTwo-sample hypothesis testing for comparing numerical populations, plus a recap of p-values, null distributions, and significance cutoffs.
- 20-CausalityExplains causation, randomized controlled experiments, potential outcomes, and how random assignment supports causal conclusions. Reviews p-values, error probabilities, and hypothesis-testing methods.
- 20-CausalityReviews statistical hypothesis testing and causation, using birth weight and maternal smoking to distinguish association from causation and introduce randomized controlled experiments.
- 21-ExamplesExplains p-value cutoffs as error probabilities and applies hypothesis testing to examples, including soda preferences and the effects of simulations, sample size, and differences from the null.
- 21-ExamplesExplains p-values, significance cutoffs, and error probabilities in hypothesis testing, with coin-toss simulations and examples.
- 22-Midterm ReviewReviews probability calculations, simulations, tables and arrays, histograms, hypothesis tests, test statistics, and p-values.
- 22-Midterm ReviewMidterm logistics, hypothesis testing, p-values, null distributions, and how simulation count, sample size, and effect size influence test results.
- 23-Confidence IntervalsExplains percentile calculations, estimating population parameters, and using bootstrap resampling to measure uncertainty and construct confidence intervals.
- 23-Confidence IntervalsIntroduces percentiles and their computation, then uses them to motivate the bootstrap method for estimating confidence intervals.
- 24-Interpreting ConfidenceExplains bootstrap confidence intervals, their interpretation and limitations, and how to use them for hypothesis testing.
- 24-Interpreting ConfidenceExplains estimation, sampling variability, the bootstrap, and how to calculate and interpret confidence intervals.
- 25-Center and SpreadExplains averages, medians, standard deviation, Chebyshev’s inequality, and standard units as measures of center and spread.
- 25-Center and SpreadConfidence intervals can test null hypotheses before the lecture shifts to quantifying data distributions’ center and variability.
- 26-The Normal DistributionExplains the normal distribution, standard deviations and bell-shaped curves, and how the Central Limit Theorem applies to sample averages.
- 26-The Normal DistributionStandard units and z-scores: how they’re calculated and used to compare data, plus an introduction to bell-shaped curves and normal distributions.
- 27-Sample MeansThe central limit theorem explains why averages from large random samples are approximately normally distributed, and how sample averages vary.
- 28-Designing ExperimentsConfidence intervals for population means and sums using the central limit theorem, plus sample-size choices for achieving a desired estimation accuracy.
- 29-CorrelationExplains correlation as a measure of linear association, how to interpret its values, and pitfalls such as nonlinearity, outliers, and confusing correlation with causation.
- 29-CorrelationIntroduces prediction as educated inference from incomplete data and previews correlation, linear regression, and machine learning applications.
- 30-Linear RegressionExplains correlation and linear regression, including predictions using standard units and the regression line’s slope and intercept.
- 30-Linear RegressionReviews standard units and correlation, then begins deriving the linear regression equation for fitting lines to data.
- 31-Least SquaresExplains the least-squares regression line, prediction errors, RMSE, and numerical optimization for finding the best linear fit.
- 31-Least SquaresExplains linear regression as a best linear predictor, including standard-unit calculations, correlation, and examples of predicting numerical outcomes.
- 32-Guest Lecture: DJ PatilIntroduces data scientist and public policy leader DJ Patil and highlights President Obama’s remarks on data science.
- 32-Guest Lecture: DJ PatilThe history and origins of data science, from ancient civilizations and wartime codebreaking to post-9/11 efforts to find signals in data.
- 33-ResidualsExplains least-squares regression, residuals, and residual plots for assessing linear fit and identifying patterns or outliers.
- 33-ResidualsExplains least-squares linear regression, residual plots, and how regression error helps assess a fitted line. Preview of testing whether an observed slope reflects a real association or chance.
- 34-Regression InferenceRegression prediction and inference, including bootstrap prediction and slope confidence intervals and tests for a nonzero trend.
- 34-Regression InferenceRegression residuals, fit quality, and properties of least-squares errors; introduces using confidence intervals and bootstrap to make population-level predictions.
- 35-Updating ProbabilitiesExplains conditional probability, tree diagrams, and how to update prior probabilities using evidence such as medical test results.
- 35-Updating ProbabilitiesBayes’ theorem, conditional probability, and interpreting medical test results, including false positives and false negatives.
- 36-ClassificationIntroduces classification as categorical prediction, with examples in text, images, and video, and explains training and nearest-neighbor classifiers.
- 36-ClassificationIntroduces classification as prediction for categorical outcomes, using similarity and features; illustrates spam filtering as a real-world example.
- 37-ClassifiersNearest-neighbor classification, distance calculations, choosing neighbors by majority vote, evaluating accuracy, representative samples, overfitting, and standardizing attributes.
- 37-ClassifiersNearest-neighbor classification, training and test data, and a medical example detecting breast cancer from cell images.
- 38-Case Study: TechIntroduces machine learning prediction, from training models to image recognition, depth estimation, and automated officiating, with key challenges and considerations.
- 38-Case Study: TechReview of classifier evaluation using training and test sets, accuracy, and nearest-neighbor tuning.
- 39-ConclusionCourse wrap-up, final exam preparation, student feedback, and next steps in the data science program, including teaching opportunities.