Comparison chart of two concepts
Name two concepts that are easy to confuse. Winda writes one table of the dimensions that tell them apart, and the three points people mix up most.
Free to start · No credit card needed
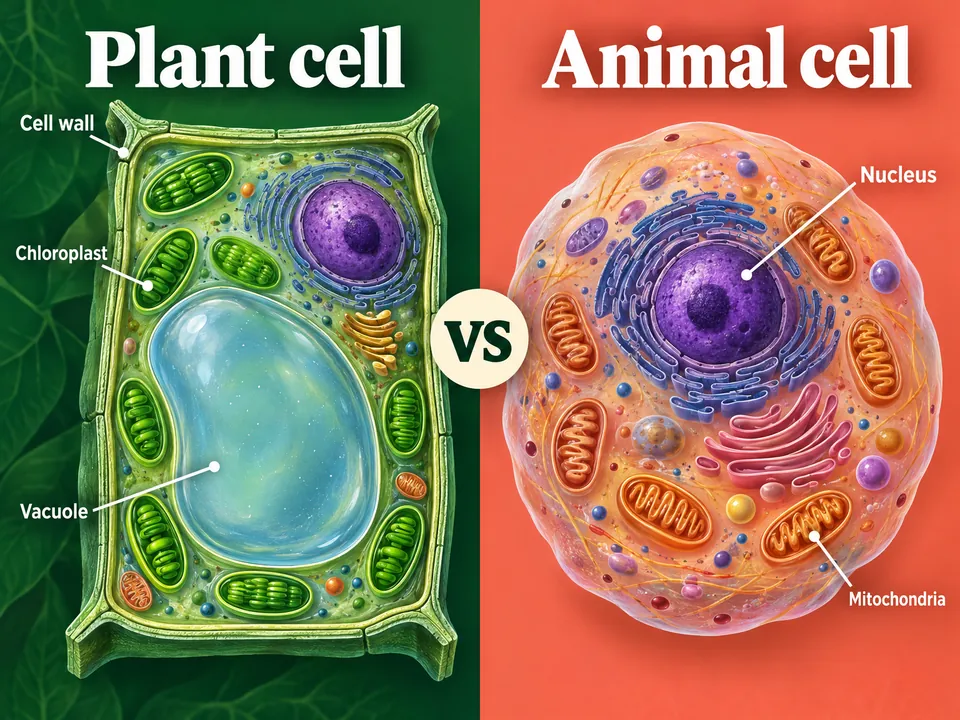
What you get
- One table
- A row for each dimension that tells the two apart, and a column for each concept.
- The points people confuse
- The three most common mix-ups, each with a way to tell which is which.
- From your material
- With a file in the project, the rows use your course's terms and examples.
How it works
Say what it is about
Name a topic, or add a PDF, a lecture video, an article or your own notes. With files, the result is written from them.
Winda makes it
The template sets the form, so you do not write a prompt. You choose the model that does the work: Claude, GPT, Gemini and others.
Keep it and change it
The result is saved in your project beside your files and chats. Ask for a change in the chat, or make flashcards and a quiz from the same material.
Questions
The template is made for two, because that is where confusion happens. For three or more, ask in the chat for a table with a column for each.
The comparison is a document with a table, so it holds more detail. The Venn diagram is a picture of what two things share and where they differ, with a few words in each region.
Yes. The Mix-ups template makes flashcards in which every card asks which of the two concepts a property or an example belongs to.
More templates
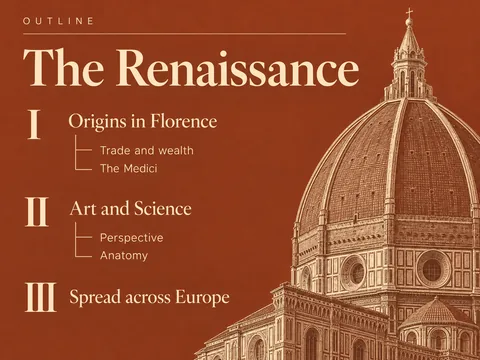 OutlineA review outline for an exam: the points in layers, a line each.
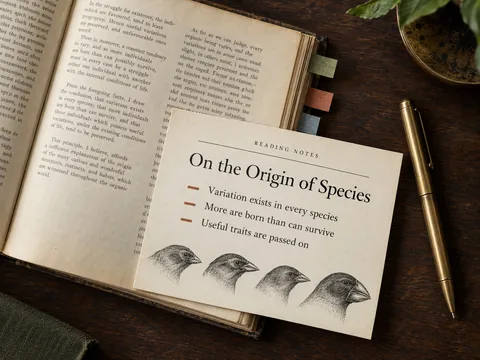 Reading notesA book or text's core ideas, how its argument is built, and questions to think about.
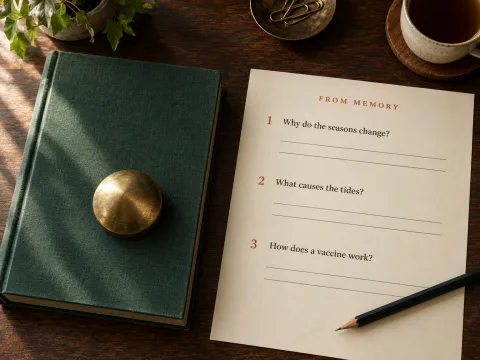 Recall questionsOpen questions to answer from memory, with the answers kept apart at the end.
 MnemonicsAn acronym, a sentence or a picture for facts you must know by heart.
Learn deeply. Create freely.
A learning space to read, chat and create.
Free to start · No credit card needed